Reference
JavaScript
The same engine as wasm on npm, and an Ink widget.
Terminal plotting for JavaScript: a small grammar of marks, honest axes, millions of points.
The engine is the Rust crate 1.x, compiled to WASM. A plot is a value. Hand it a frame and it draws; the function is pure. The library never owns the terminal, and it has zero native dependencies.
The docs put a plate on every mark, stat, and scale, and the playground runs this same engine in the browser: shergin.github.io/malevich.
npm install malevich
npx malevich              # a tour, sized to your terminal
printf '1 5 2 8' | npx malevich line
ESM only: Node 18+, Bun, and Deno. require() is not exported.
import { line } from "malevich";

console.log(line([1, 5, 2, 8]));
7.5 ┤ ⡠⠊
│ ⡠⠊
│ ⡠⠊
5.0 ┤ ⣀⠔⠊⠑⠢⢄⡀ ⡠⠊
│ ⣀⠔⠊ ⠈⠑⠢⢄⡀ ⡠⠊
2.5 ┤ ⡠⠔⠉ ⠈⠑⠢⢄⡠⠊
│⡠⠔⠉
0.0 ┤
└┬──────────┬───────────┬──────────┬
0 1 2 3import { Frame, Line, Plot } from "malevich";
const loss = [4, 2.8, 1.9, 1.2, 0.8, 0.6];
const chart = new Plot()
.layer(Line.y(loss).label("loss").style("Corners"))
.title("training");
console.log(chart.render(Frame.detect()));console.log(plot) and String(plot) detect a frame. plot.render(frame) is
the pure path. In a test, pass Frame.plain or Frame.portable.
This is 0.x. The JS API can still move. The renderer is the 1.x Rust crate
(engineVersion).
Why malevich#
The JS terminal already has charts. What it does not have is this engine.
- Eight marks, and that is the catalog. Line, points, bars, area, cells,
range, rule, and text, composed with a stats layer and shared scales. That
is the basic catalog. Presets (
line,hist,boxPlot,violin,trend, …) are packaging: the same plot you would write by hand. - Axes that are actually good. Ticks are placed by extended Wilkinson.
Labels are exact decimals, and they parse back to their values. One SI
prefix per axis. Log axes, calendar time, band axes. Never
0.30000000000000004. - Millions of points. A long line reduces by M4, one bucket per rendered column, and the pixels match drawing every point. Ten million points is a CLI one-shot, not a 50 fps zoom loop in WASM. Typical sizes are still tens of milliseconds.
- A bad terminal still gets a chart. The ladders run from Unicode 16
octants down to plain ASCII, and from truecolor down to a clean pipe.
NaNis always a visible gap. - A plot is a value. Builders are immutable. There is no hidden terminal
state.
Plot.render/Plot.rasterinspect nothing. Detection lives inFrame.detect.
The argument is in the crate's docs/vision.md. This package is the JS rim around that crate. One oracle, not a rewrite.
Presets and the grammar#
import {
  Area, Frame, Grid, Line, Plot, Points, Rule, Text,
  bar, boxPlot, density, describe, ecdf, heatmap, hist, hist2d,
  line, scatter, stairs, table, trend, violin,
} from "malevich";

console.log(bar(["mon", "tue", "wed", "thu", "fri"], [3, 7, 4.5, 8, 6]));
console.log(hist(samples));
console.log(boxPlot(["train", "val"], [trainLoss, valLoss]));
console.log(describe(["train", "val"], [trainLoss, valLoss]));
Eight marks: Line, Points, Bars, Area, Cells, Range, Rule,
Text. A preset is a proven composition. Shared goldens prove the JS output
is byte-identical to the crate, for the same document and frame.
import { Bars, Cells, Colormap, Range } from "malevich";

new Plot().layer(Cells.matrix(4, values).colormap(Colormap.VIRIDIS));
new Plot().layer(Range.over(["a", "b"], low, high).body(q1, q3).marker(median));
new Plot()
  .layer(Bars.new(["a", "b"], lower).label("a"))
  .layer(Bars.new(["a", "b"], upper).base(lower).label("b"));
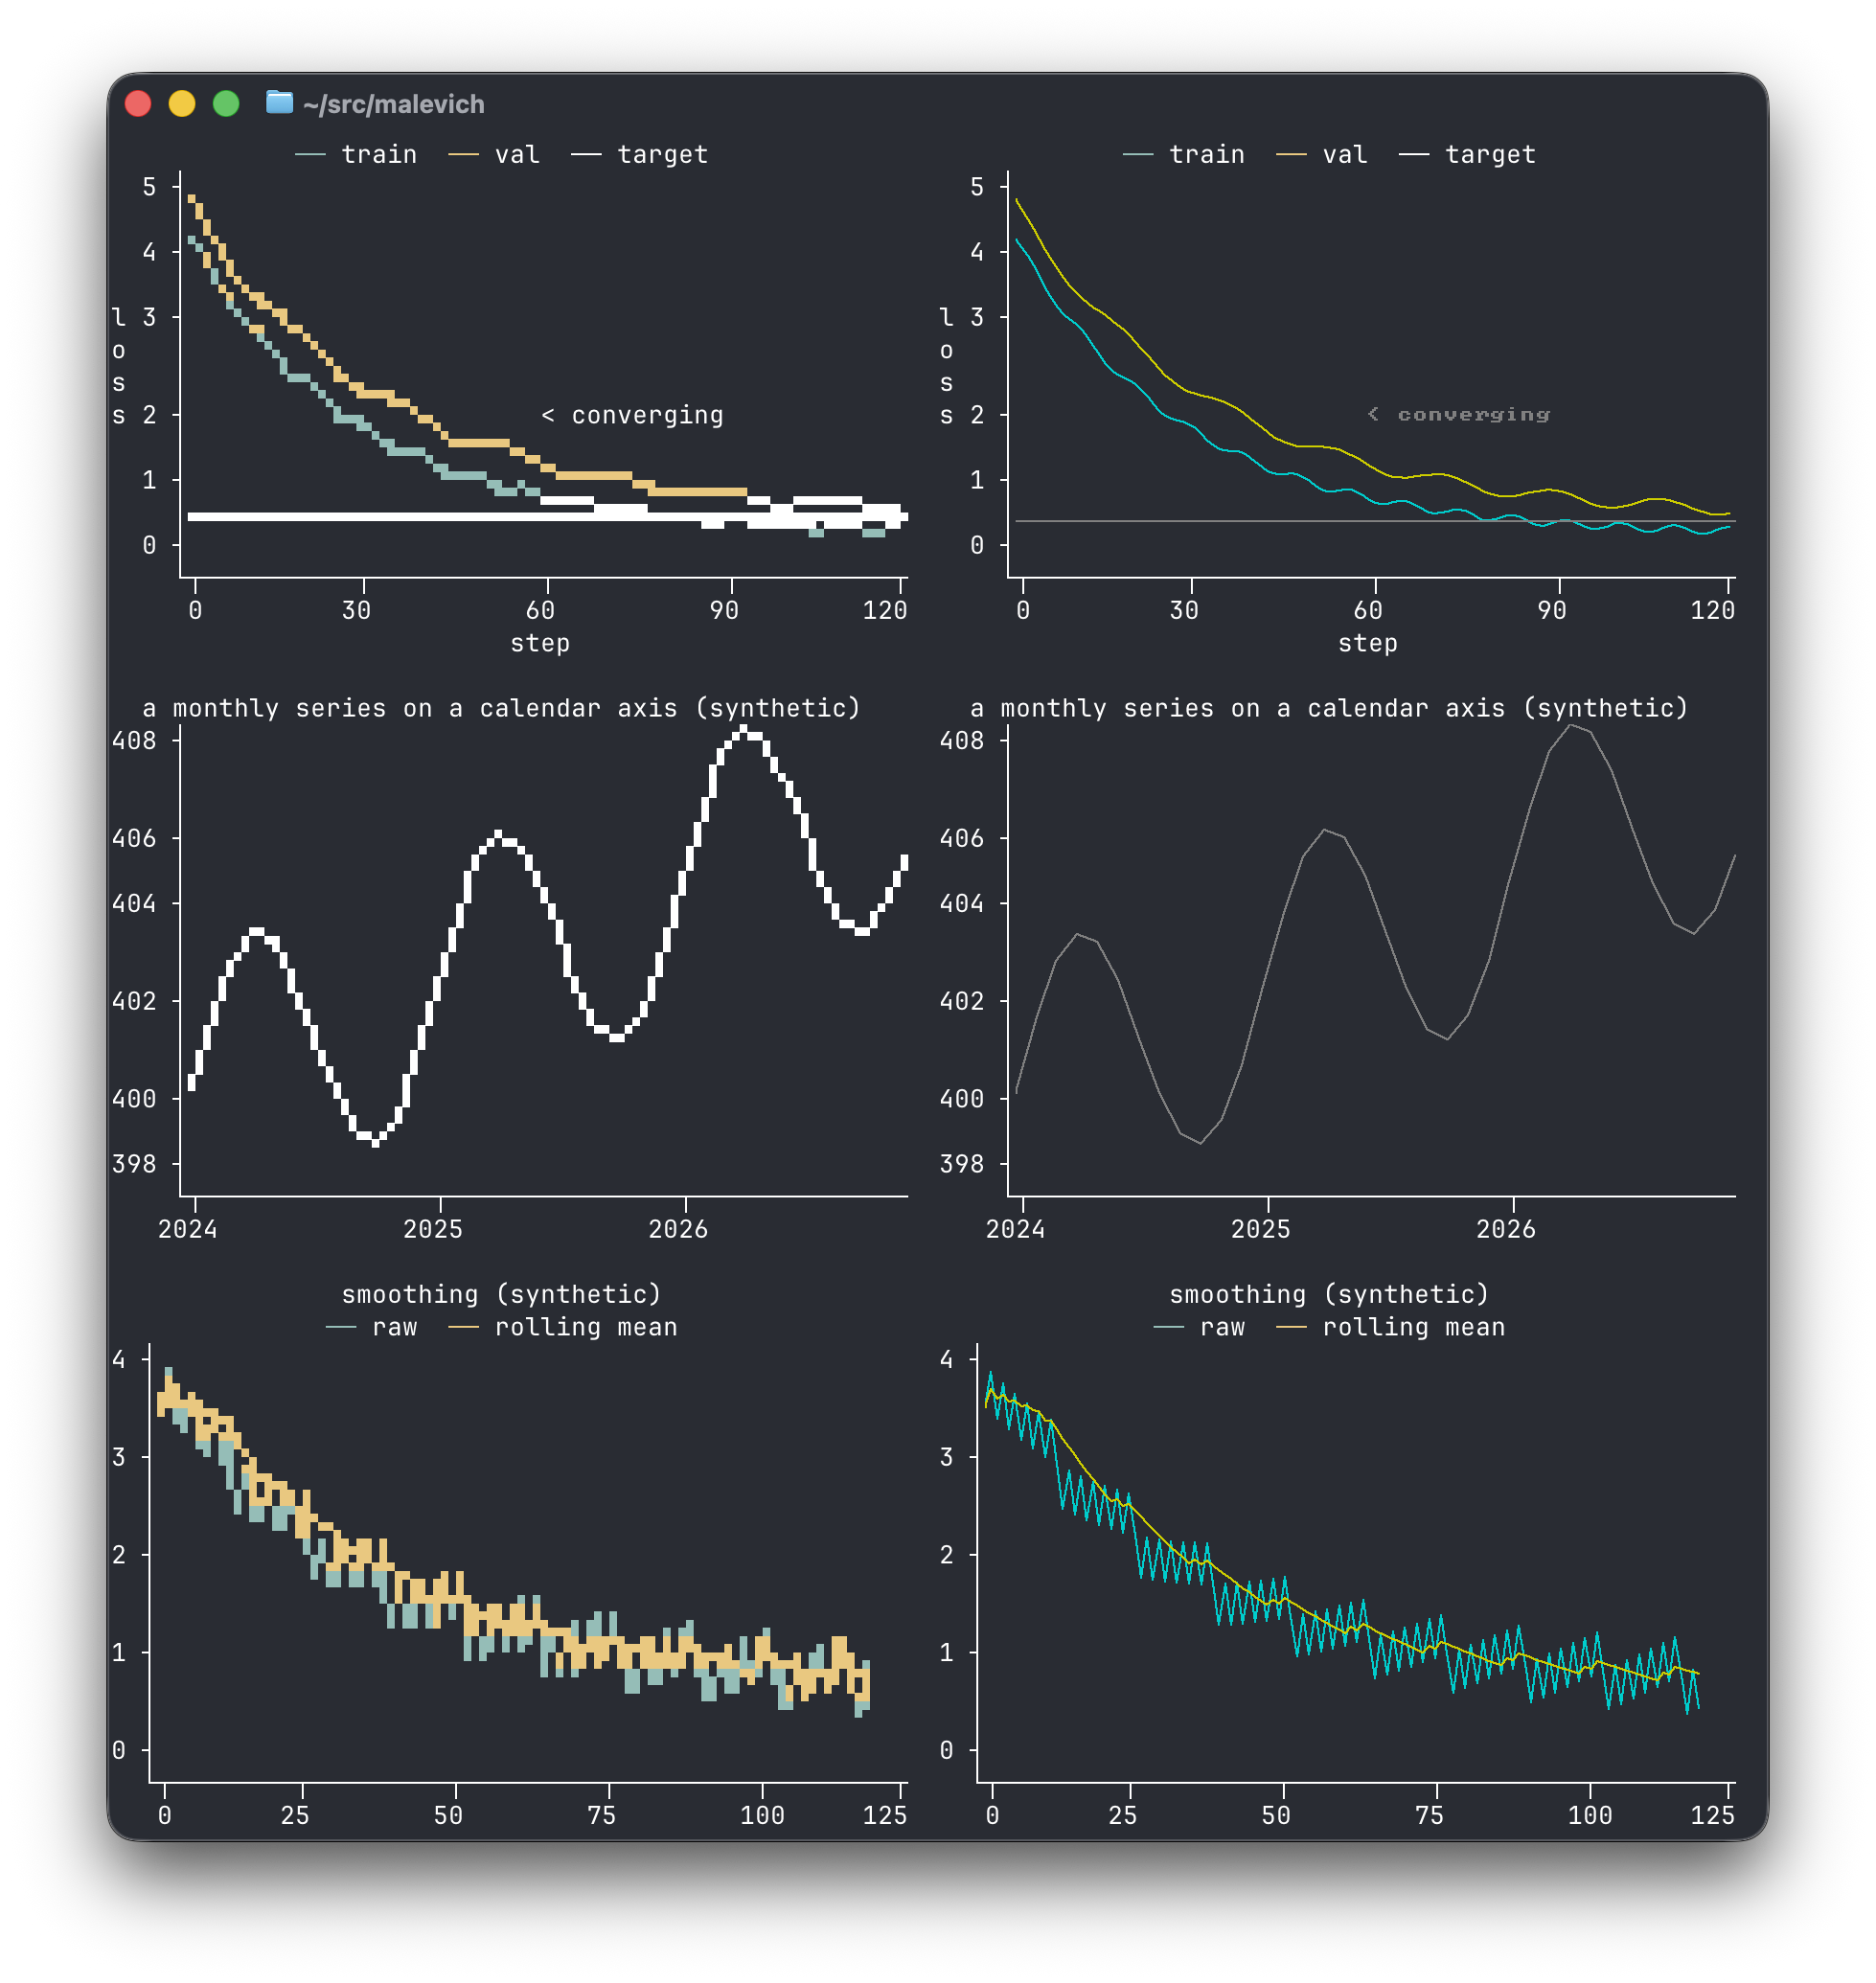
const chart = new Plot()
.layer(Line.y(train).label("train").color("Cyan"))
.layer(Line.y(val).label("val").color("Yellow"))
.layer(Rule.h(0.5).label("target").dash("Dotted"))
.layer(Text.at(80, 3.2, "overfit?"))
.title("loss")
.xLabel("step")
.yLabel("loss");null and undefined in a series become gaps (NaN). A Float64Array is
kept by reference. Nested {x, y}[] is not a series. A mark that wants two
channels takes two series (Line.xy(x, y), scatter(x, y)).
Frame#
Size, charset, color, theme: where and how this drawing goes. A frame is run state, not plot state. The same plot renders into many frames.
| constructor | what |
|---|---|
Frame.detect() | reads process.env and the stream: size, NO_COLOR, COLORTERM, TERM, MALEVICH_CHARSET, COLORFGBG |
Frame.plain(w, h) | braille, no color — the snapshot form |
Frame.portable(w, h) | quadrants, no color — conservative Unicode |
frame.with({ height: 8 }) | copy with fields replaced |
Wasm never reads the environment. A snapshot test always passes an explicit frame.
Raster#
plot.render(frame) is a string. plot.raster(frame) is the cell grid
under it: glyphs and colors, chrome included, so a TUI host can paint cells
instead of decoding ANSI.
const raster = chart.raster(Frame.plain(40, 10));
for (const row of raster.rows()) {
  // row: { glyph, foreground, background }[]
}
A continuation cell (columns === 0) sits to the right of a wide glyph, and
rows() skips it.
Mapping and viewport#
plot.mapping(frame) is the geometry of one render, already resolved: cell
to data and data to cell, labels as the axis formatted them, and the plot
rectangle. Viewport is a pair of optional axis windows. A zoom is a scale
option, not a render mode, so M4 re-aggregates to the visible window on the
next render.
const mapping = chart.mapping(frame);
const data = mapping.dataAt(column, row);      // [x, y] or undefined
const view = mapping.viewport().zoomX(0.8, data[0]);
console.log(chart.viewport(view.windows()).render(frame));
A host that wants different gestures from the Ink widget drives this physics directly.
Ink#
Optional. Install ink and react, then:
import { line } from "malevich";
import { PlotWidget } from "malevich/ink";

<PlotWidget plot={line(loss)} width={80} height={16} />
That paints on its own. For interaction, keep a PlotState in a ref, the
same controller as the ratatui widget, and hand it mouse coordinates. The
widget never reads the terminal.
import { useRef, useState } from "react";
import { line } from "malevich";
import { PlotState, PlotWidget, usePlotInteraction } from "malevich/ink";

function Chart({ loss }) {
  const state = useRef(new PlotState()).current;
  const [, bump] = useState(0);
  usePlotInteraction(state, { onChange: () => bump((n) => n + 1) });
  return <PlotWidget plot={line(loss).title("training")} state={state} width={80} height={16} />;
}
The gestures are fixed on purpose:
| input | effect |
|---|---|
| hover | crosshair; the readout snaps to the data |
| wheel | x zoom anchored at the data under the cursor |
| left drag | pan, every continuous axis |
| right drag | rubber-band selection; zooms to it on release |
+ / - / arrows / r | zoom, pan, reset (usePlotInteraction keys) |
Coordinates outside the plot rectangle are ignored. A band axis has no
continuous window, and it stays untouched. A gap at the snapped x reads as —,
never an interpolation. crosshair={false}, readout={false}, and
snap={false} turn the overlays off. Overlays draw into the cells only. The
plot value renders identically with them or without them.
usePlotInteraction is a proven composition. It enables DECSET mouse tracking
on Ink's stdout and parses SGR from Ink's stdin. One hook per app. For two
panes, parse at the app level and route (see examples/ink-linked.tsx). Skip
the hook and drive PlotState.onMouse yourself if you want a different
policy. enableMouse, parseMouse, and linkX are public.
Linked panes. Two stacked charts share an x view because you assigned it, not because a feature did. Route the event to the pane it landed on, then:
import { linkX } from "malevich/ink";

linkX(active, passive);   // share the x window; mirror the cursor
Each pane keeps its own y. The passive pane draws a vertical-only crosshair
at its column for that x (mapping.columnAt), snaps its own series, and
reads out the same instant.
Wrap stacked panes in PlotColumn and each PlotWidget gets origin from
the heights above it. No row math by hand. Pass origin
yourself only when the layout is not a column.
import { PlotColumn, PlotWidget } from "malevich/ink";

<PlotColumn>
  <Text>header</Text>
  <PlotWidget plot={main} state={mainState} height={16} />
  <PlotWidget plot={ctx} state={ctxState} height={8} />
</PlotColumn>
A live tour, in this repo: npx tsx examples/ink-zoom.tsx (two million points,
wheel-zoom into any spike). Linked panes: npx tsx examples/ink-linked.tsx.
Pixels, when the terminal speaks them:
console.log(chart.renderBest(Frame.detect()));           // sniff env, then cells or image
console.log(chart.renderPixels(frame, { protocol: "kitty" }));
Detection stays in JS. The wasm path is pure: it encodes the protocol you name.
What it will not be#
Not a TUI framework. It never owns the terminal, and it does not handle
input. No animations. No file parsing, and no dataframes. Conversion happens
once, at the rim, into a Float64Array (NaN = gap). Not a config object
that takes every option at once. Not a browser charting library. renderBest
is still a terminal string.
Engine#
| npm | malevich 0.x |
| crate | malevich 1.x (engineVersion) |
| artifact | malevich_js_bg.wasm (~256 KB gzipped) |
| license | MIT or Apache-2.0 |
More#
A full colored tour, sized to your terminal:
cd js && npm run build && npm run showcaseExamples are in examples/. Crate docs: interaction,
terminology,
vision.
License#
MIT or Apache-2.0.
Build from this repo#
cd js
npm install
npm run build
npm test
node examples/hello.mjs
npm run showcase
You need a Rust toolchain with wasm32-unknown-unknown and wasm-pack.